Uwe Weiss @ Blue Yonder - Foto: Martin Leissl

Uwe Weiss On Predictive Analytics

[vc_row][vc_column][vc_column_text]LUTZ FINGER: Uwe Weiss – you are long-standing entrepreneur and the CEO of Blue Yonder, a predictive analytics company. Thanks for being with us.

UWE WEISS: Thank you for having me.

LUTZ FINGER: You landed a really large deal last year. Your company got funded by Warburg Pincus. The deal was for whopping 75 million USD – one of the biggest European investments in 2014. What does Blue Yonder do?

UWE WEISS: We create predictive application platforms. We were founded in 2008. We offer predictive analytics for various industries.

LUTZ FINGER: You used the words “predictive analytics.” That’s today one of those hype terms. You did not use the words “big data” – how come?

UWE WEISS: You caught me. I think big data is a meta term like the expression “internet of things.” These concepts make data accessible. Big data as well as predictive analytics have been on the market for a while, but predictive analytics has traditionally meant means data mining and looking at past data. To expand, we needed an applications platform that helps decision-making based on analytics and large amounts of data. We are happy to work with in the “big data” wave and we are happy to work with the “internet of things,” but whatever we do, we need to prove the value that these terms might bring.

Blue Yonder Logo

Blue Yonder – Forward looking – Forward thinking

LUTZ FINGER: Haven’t predictive analytics been around since the 80’s? We had business intelligence and everybody got excited about having big databases, which we didn’t call “big data” at that time. BI uses predictive analytics, in order to do something that is actionable. Now, what has changed since the 80’s? Except that we are all 34 years older.

UWE WEISS: Many major technology trends really need a while until they find broad use and many things have to come together. You need time for new technology to finds its’ way into the market. We are now in the exact the right place. This is seen in the transition of business intelligence. First there was reporting, and then it was business intelligence analytics and visualization. Great companies have come out of this market, but what we understand about predictive analytics is that it is something that falls neatly into the mold of the big data scheme. With much better hardware we can run predictions on more data and faster. The software layout is transactional: the present source planning, warehouse management, order fulfilment, ecommerce execution and the analytical layout. These layers were traditionally separated in most software, from an architecture perspective. What is new is that these layers stay together, so analytics meet transaction.

LUTZ FINGER: Nice. Analytics meets transaction. That’s “tweetable.” (Tweet NOW!) You are in a super “hot” spot right now. In the last year, I have noticed a lot of companies claiming a similar space. Earlier, you mentioned the “internet of things.” Otto is one of your shareholders, which is a big retail chain in Germany. Last year, Google Ventures invested $2 million in seed funding in Frame Data, to do user behaviour predictive analytics. And Reflection Capital, Intel capital and Nike made a big investment as well into startups supporting retailers. Lattice Engines got a $20 million investment, and they do marketing predictions. That’s a lot of big investments. And now, you, with $75 million. This is the top of the top. What makes the difference?

Analytics meets Transaction

UWE WEISS: The predictive analytics technology and concepts have been on the market for a long time, as we talked about before. It is still a relatively early market when it comes to the adoption and the enterprise level. We are talking about adoption cycles. Most people within the predictive analytics area try to find their way in the market using domain knowledge. We tackle the broader market of the underlying platform for predictive applications across domains. Generically, we have solved many of the tricky questions of data digestion, time series management, and the handling of lots of diverse machine learning algorithms because we don’t think that there is a one size fits all algorithm in the world. We believe in robustness and bring enterprise-level 24/7 usable consumable cloud software on top of service. We are not just a tool and we are not restricted to one domain. We are ambitious enough to say that we can tackle the free-to-form verticals based on scalable protocol – generic, predictive applications.

LUTZ FINGER: In this market, there is the debate about how much domain knowledge is needed versus how much technology knowledge is needed. You have created a platform out of this technology knowledge and go one industry at a time, instead of building a solution around domain knowledge only. That’s the way you are tacking it?

Domain Knowledge is Important but not Everything

UWE WEISS: It is dangerous to remain in only one domain, because you tend to build your software architecture around your domain. You can run very fast and catch a lot of market share. But then you get stuck. We go for the broader perspective and we have seen that we can – with our people and our engineering – tackle more domains and add domain knowledge relatively easily. We usually don’t have to start from zero and are able to have vague domain specialties integrated into our platform rapidly. We don’t tackle all of the vertical markets. At the moment we focus on retail, consumer goods, completing our roadmap there, but we have a growing number of customers in travel, manufacturing and energy. If a new market looks healthy from a growth perspective, we enable ourselves to go into more domains. For our customers, that means solving more than one problem at a time.

LUTZ FINGER: I published the book, “Ask Measure Learn.” I claim that domain knowledge is important in the “Ask,” which is the business-oriented part. What would make you guys different from the platforms that are out there already, like R-studio or SPSS?

UWE WEISS: I see one difference between ourselves and other players. We learned early on that there is a market for tools, applications and solutions. If you tackle this market, you will always be a part of critical enterprise processes like pricing, replenishment, customer management, and customer complaints. You have to build a platform with high availability – 24/7availability – and have to have super robust machining algorithms and domain knowledge. There has to be a transactional layout. That means we don’t only have the findings and insight, we also execute milions of transactions for our customers. We set the prices in their e-commerce platforms, we make replenishment decisions and so on. The transaction volume and throughput comes into play. When you have customers which process hundreds of millions of transactions per day per customer, you have to have a scalable platform which does not only contain the insight part, which you probably would call the “measure” part and “learn” part, but you also have to have the transactional part that can execute transactions and permanently integrate data sources into a streaming process. You also have to make decisions. That’s a differentiator we see in the market, and we see the market moving more and more towards supporting companies to become predictive enterprises. It’s great to have predictive analytics insights, open source tools or other available tools, but in the end, when you have these great insights, you want to transact and want these insights to become a part of your transactional software landscape. And that is the path we are following in the market and that is the right one for us.

LUTZ FINGER: There are two approaches here. One approach is to use domain knowledge and create a specific solution. However, in enterprise software terms, it becomes harder to scale; therefore, you built the platform with the scaling piece and with domain knowledge. You scale up and enable mutual frameworks for everybody.

Automated Decision Making

UWE WEISS: Our theory is that 99 percent of operative business decisions can be automated, and to automate these decisions, you need predictive analytics. You also need the automation piece and the execution piece, the throughput and the scaling piece. You need to be able to take all of the bits and pieces in an architecture together to make a complex configuration: data signs, learning, machine learning, in memory databases, time series robustness. Add this to enterprise release management and software release management. With these components, you have a platform which can also execute on analytic insight and automate. We tell our clients, “99 percent of your operative business decisions can be done automatically; the exceptions are the ones you should work on with your team.” 99 percent of decisions today are the same decisions you have made in the past. This means you didn’t learn from the data. The automation piece is essential for the usage of predictive analytics, so we see the tendency of analytics offerings getting into this transactional execution market. We also see enterprise software companies trying to glue on predictive analytics pieces.

LUTZ FINGER: So we are scaling up because we are using enterprise software, and we are automating the “science” aspect of this area of expertise.

UWE WEISS: Amazon, for example, has a recommendation engine with automated processes. They are the masters of business decision-making and recommendation automation. They are also the masters of using science and the enterprise software landscape.

Sustainable Growth Market

LUTZ FINGER: I was slightly surprised to see that the investment was provided by Warburg Pincus, because they are known as a private equity company. All of the other deals I listed out were made by venture capital companies. How come?

UWE WEISS: In looking at the maturity of the technology, many of the VC’s have made their early stage investment in predictive analytics offerings. These successful companies are already in a place of growth and not in the seed or early phases. The technology today is is ready-to–rock for an exponential growth – the technology can be applied widely. Private equity investors have seen that and they believe we are operating in a very sustainable growth market. It is healthy in terms of growth and independent from any short-term cycles or hype terms like “big data.” They see that large enterprises and many verticals require predictive capabilities. Predictive analytics is at the core of many services and initiatives. VCs have seen the opportunity in the market. We are convinced that predictive analytics is something all large enterprises and also fast-growing enterprises will use in the near future. Private equity companies believe in the long-term possibility of this market and that this market is growing independently from cycles or economic downturns. I don’t think that their investment is fashionable; I think it’s because of their fundamental belief in this sector.

LUTZ FINGER: You noted that BI has been around since the 80’s, but that it takes time off adaption. When we look at scaling up, we see the availability of data, we see that the machines are there, and therefore there is a scale effect which manifests itself in enterprise software.

UWE WEISS: Yup. The whole sector of analytics is capturing more market share and enhancing BI. Approximately 95 percent of BI budgets went into reporting, visualization and dashboarding. BI. This is a healthy, multi-billion dollar market with nice growth rates in a growth phase. That is important to private equity. In an economic downturn, enterprises will still run this software and pay for it. If you have embedded critical enterprise process – like pricing, replenishment, logistics, supply chain yield management – you are fairly independent from economic cycles because people buy food, people go into restaurants, people go into a train or have to buy a ticket, and so predictive applications will have their space. Fundamental belief in predictive analytics as a growth area is responsible for private equity entering this area. You will see more private equity deals, I think.

Fast growing software service businesses need substantial investment to grow. This phase of the market has become attractive for private equity, and because of the ticket size and the growth, predictive analytics companies can improve right now.

Blue Yonder, Karlsruhe, 27.01.2015

Uwe Weiss @ Blue Yonder – Foto: Martin Leissl

LUTZ FINGER: Got it. The first thing I thought when I saw your deal was that it proves the Gartner hype curve wrong. In the Gartner hype curve, he says that predictive analytics is at the top of the hype cycle. That would suggest that we will soon be slowing down. What you are saying is that we are in a stable situation. We are on the far end. Predictive Analytics is ready and we can roll it out.

Plateau of Productivity

UWE WEISS: I fundamentally think that the technology is at the “plateau of productivity”. People can use this technology now and produce ROI. Analysts talk about prescriptive analytics already. A week ago, Davenport published an article on “Automated analytics.” I like this term – meaning that the analytics layout marries the transactional software layout. Predictive analytics are not for a homogenous market. The tools have been in the market for a long time. Many people talk about machine learning and one size fits all algorithms right now in regards to various learning technologies – supervised learning, reinforcement learning, and deep learning.

You need to be capable of working with all of these learning technologies, but we also need to be capable of embedding it into enterprise processes. To do that, you need material software. Your software has to work for many years. For example, building enterprise software hasn’t changed much in the past years. The fact that you are building robust enterprise software infrastructure is something that you still need to prove to your customers. This has not changed.

LUTZ FINGER: I totally agree. What will we be seeing next from Blue Yonder? You said that some of the funding will be used to internationalise and expand. You’re very well-known in Europe, and definitely super well-known in Germany. This investment was the biggest deal in Germany in the last year. What can we expect to see next from Blue Yonder?

Expansion

UWE WEISS: We did the biggest software deal in Germany in the last year and one of the five biggest software deals in Europe, excluding ecommerce and also technology enabled businesses. We are based in Germany, the UK, and have a substantial operation also serving the Nordic countries. I think we foresee expansion into the US in 2015 and we already have a few interested customers in the US. I am convinced we will have our foothold in the US in 2015. We are one of the next companies coming out of Europe that will become international by also being established in the US. I think we want to keep a healthy mixture of European style and American style. We are also looking into Asia and the Middle East, but we want to place our bets on the right areas, so America is definitely the next step on our internationalization roadmap. Product-wise, we will focus on the domains we have defined for ourselves. This gives us a lot to do for the next 24 months. I am convinced that we will see a mass market for predictive applications from 2016 onwards. All of the global 2000 Leading Companies in all relevant industries will need to adapt and use it.

LUTZ FINGER: Wow, that’s a cool prediction. I am going to go with that one. Thanks a lot for being with us.

UWE WEISS: Lutz, thanks a lot.[/vc_column_text][/vc_column][/vc_row]

Personality analysis

Give Me The Data! Why So Many Data Ideas Fail

[vc_row][vc_column width=”1/1″][vc_column_text]To build a data product you need to have the right data. This sounds simple, but it is often forgotten by entrepreneurs or top managers alike. Data should not be confused with the product or the business question that makes it powerful. But even if you have a great idea, it comes down to having the right data to make it feasible.

I recently had lunch with a young and highly energetic entrepreneur. He envisions a database containing psychograms of people. Think about a CRM system that not only contains the phone number of your contacts but also a personality profile. Can you imagine what Frank Underwood the main (and mean) character in “House of Cards” could have done with such a tool? Thus no question – even when I have loads of questions in regards to privacy; ethics – I get the value of that tool.

But unfortunately Ideas are easy to dream up, I have a whole scratch Evernote book full of what we could do with data – but is it feasible? If you are a starup person you know this issue:

#Ideas are commodity. #Execution of them is not. – Michael Dell, Dell chairman and CEO – Click to Tweet

In the Data world Michael Dells quote can be adapted.

Ideas are commodity. #Data of them is not. – Click to Tweet

Likewise, Amazon did not think of building a ‘recommendation’ engine. They thought about selling books online and suddenly they had the data – and only then did they think about how to improve those services by using data and recommendation engines.Many of the big data war-stories you read today are based in this area. Another example is how UPS reduces maintenance costs by measuring vehicle performance and understanding patterns of use, then pre-emptively replacing parts before they break down.

I often get asked how to drive product innovation using data. The answer is not much different from any other innovation you do. Alistair Croll(@acroll ) who had interviewed many different product managers or so called innovation officers breaks innovation down into three distinct classes: Sustaining, adjacent and disruptive (read more about Alistair’s ideas here). Data are commonly used in ways that Alistair calls “‘sustaining”. Take Sears as an example: the large retailer began using big data in 2010 to support its existing business model in areas such as combatting fraud, tracking the effectiveness of marketing campaigns, optimizing pricing, and more.

But the use of data can be disruptive as well. TakeLinkedIn. It started out as a networking company. People connected via LinkedIn sharing information like their personal Bio and for which company they work over time. With this kind of information LinkedIn was able to match available talent with the right job opportunities. Their service became disruptive for the whole recruiting industry: to find the right talent, not only much faster but also more number driven. Or takeGoogle– it started as search company. Only later did they realize that by using their data they could change the advertising industry for good. Data has the potential for disruption, and data will change our life more than we can imagine today. On the other hand, having data in no way guarantees that disruption will happen.

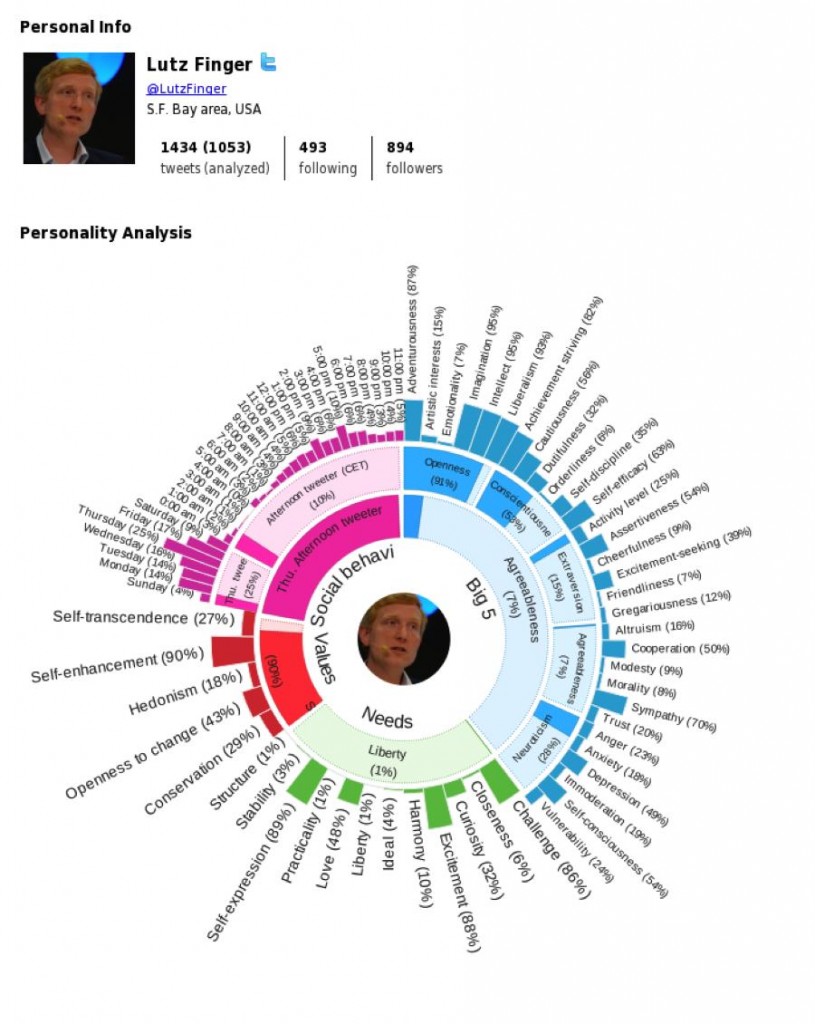
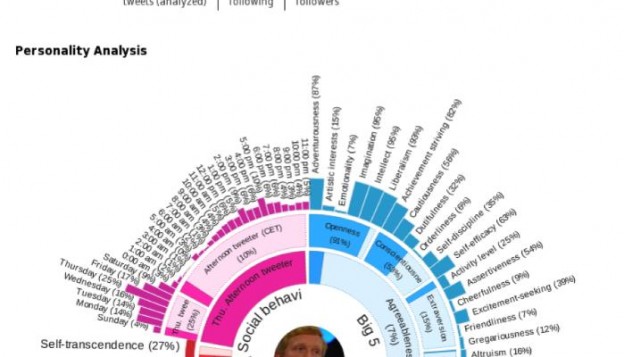
The second way is to buy data or get publicly available data.I have built and sold a company based on this idea. Fisheye Analytics gets news and social media across the world and analyzes it. These kinds of data are (apart from the infrastructure cost) free. Let’s get back to my lunch table and the young entrepreneur: public data might be a feasible way for him. He could use public data from social media to extract an psychological image. For example, take IBM’s project U. Under the leadership fromMichelle Zhou( Michelle’s Facebook Page) the IBM teams analyze the twitter stream. Michelle presented the technology to a small team at LinkedIn, and below you can see my ‘psychogram’.

095224c.png

(Picture: system-U-analyzes personality profiles based on tweets.)

I can not comment on well the tool works, mainly because the question of whether this is the “right” data depends strongly on the question you want to answer. Compared to a real psychology test, this is surely nonsense. But if you do not need a detailed test? Compare this with a thermometer. If you stick your hand out of the door in the morning to get a sense of the temperature it will be not a good or accurate measure, but it is completely sufficient to decide whether to grab a jacket or not.

Thus all what this entrepreneur needs to do is to implement something like project U and test whether this fits his business case! But be aware that public data does not create high barriers to entry for your business model. If your way of using the public data is successful, anyone can do so. Take KLOUT as example. KLOUT used to be a service that analyzes the “influence” from someone online. They use publicly available data from twitter. Soon after their launch there were many companies who tried similar things. KLOUT has pivoted by now into a very slick trending content tool. Other companies that measure influence like Peerindex are now looking for more funds using crowdsourcing. Using public data is one of the issues in maintaining their business model.

On the other hand public data is not necessarily a dead horse if you create a competitive advantage somewhere else. Take Google as example. They use linking data that is available if you crawl the web. Google’s competitors figured this out after a while. However by that time, Google had already learned more about the user and started to create a competitive advantage that has been reinforced ever since.

And the third way is B2B services: work with data from other businesses. Compass.co is a typical example (note: I am a advisor to Compass) They let companies plug in their data, and their service is to benchmark and compare them. Iris.TV is another example. As their COO Richie Hyden (richiehyden8) explained to me, they use the data from their customer to estimate what is the best next video to play. To do so, they use data from their customer: what did people tend to watch after a given video.

Today a whole range of marketing companies exist that use data from the sales process to help predict things. Thus instead of asking someone to fill out a survey about a potential client, these companies watch what the user is doing. How did he come to the website? What did he tweet about? In all of these cases, data products depend on having data.

The best data product idea is not worth anything if you have no data. Do you want to learn more on how to get to data? Subscribe to my newsletter to get some free resources about data products.[/vc_column_text][/vc_column][/vc_row]

Data Demystified

Data Demystified

[vc_row][vc_column width=”1/1″][vc_column_text]”Data Demystified” is the best way to describe this year’s Strata Conference. The Strata data conference has grown substantially this year: more visitors, more talks, more vendors at the exhibition, and more space.

But most importantly, the topics previously displayed have matured. Data is not only becoming easier, the science of data itself has become demystified. It is no longer the task of a few highly specialized data scientists or engineers: today, data is available for everyone. Tweet now! Let’s look at some trends that go beyond the usual infrastructure: sumo wrestling.

06b59b2

TREND 1 – Easier Data

Every infrastructure vendor – from storage vendors to database vendors – will tell you that you are going to get more data from buying their product. That is no surprise. However, this year one can see the trend of easy data. Getting data has become much simpler.

One way of getting data is scraping. Scraping used to be reserved for those who knew how to code. With the industry becoming more mature, this is no longer the case. Take Andrew Fogg’s (@andrewfogg) startup import.io as an example. Last year, this was just an idea at the Strata startup showcase. This year, they presented a very good and stable solution at their own booth. Import.io makes scraping as easy as point-and-click. I actually used it to scrape Autotrader.com and help me find the best priced car when I moved to the U.S. The important part is that this kind of scraping does not require code: everyone can do it. Everyone can become data-driven. We do not have to worry about technology, but rather simply formulate the right business question.

Another company in this space is enigma.io. They were my personal favorite in this year’s startup showcase. Their vision is also to make data more accessible. It is a data platform for government data. Open data – which was a big topic at Strata years ago – exists now, as governments have opened their data stores. However, this data is not often easy to use, as it is not in the right format. It is nothing a data scientist or analyst could not fix, but the trend nowadays is to make data retrieval easy. Enigma sources the data and makes it available to everyone. Again, the underlying idea is to focus on the business question, rather than the technology.

TREND 2 – Easier Clean Up

What Enigma is doing for public data is what Joe Hellerstein (@joe_hellerstein), co-founder of Trifacta, is doing for the world. Today, the biggest part of data science is ‘wrangling‘ data: in other words, cleaning and re-structuring data. Whether you want to transform all European date formats into U.S. formats or fill in the missing values in a table, you will generally need to code or script to make this happen. The trend at this year’s STRATA is to talk about how to make this task easier. Trifacta’s approach is that you can easily point and click to do all kind of ‘grep’-like regular expressions. The goal of this is to make dealing with data easier so that you do not have to worry about technology anymore.

There is, however, a second reason why I am mentioning Trifacta. The computer industry has long since anticipated that we will be able to “write code” by pointing and clicking, making it ready for deployment without actually writing it. Trifacta has really taken this idea to a new level. In the same way that programming languages represented the end of the assembly coder, companies like Trifacta might serve as the end to the data wrangler.

TREND 3 – Charting, Charting, Charting

You see charts everywhere you go at Strata. Charts are often the first and easiest way to win. Not only can they be helpful to you in exploring the data, they often astonish your audience. Thus, it is no surprise that a lot of companies try to automate this process, starting with Tableau, the top dog, followed by newcomers like DataHero or Chartio. Their promise: with a lot of connectors, we can connect to everything – from spreadsheets to Hadoop – and then see all of the data charted. Thus, there is no need to think visually anymore – just load the data and look at the colorful charts. And then, have you ever heard your audience make statements such as this?

That is so cool… If only I could understand what it means!?

Of course, these tools will not solve a single business question for you. But they do give you a nice way of representing data, so that you have all hands free to think about the real measurement you want. What is the right way to display this data so that it fits your business?

TREND 4 – Easier Predictions

This last trend relates to pure data science. How many people in your organization can run naïve bays? Or SVM? Or nearest k neighbors? Not many… And this is true not only for you, but for many organizations (unless you are a company like LinkedIn – and yes, we are looking to hire even more of the aforementioned people!) Tweet to us if you want to join

With the data industry maturing, data science is also maturing. Easy plug-and-play solutions have become more and more available. For example, take a look at companies like wise.io, co-founded by Joshua Bloom (@profjsb), or Skytree, founded by Martin Hack (@mhackster). They offer tools to simplify predictive algorithms. It is like the WEKA package on steroids. Just upload your data and then score it, rank it, rate it… All automated. Worry free. Again – the underlying trend is to free us from technology so that the most important focus is put on the business.

A point on demystifying data science was best made by John Foreman (@john4man), author of the book Data Smart. In order to demystify funky artificial intelligence packages, his tutorial trained the audience on how to use Excel to build machine learning programs. Really? Excel? I thought John was out of his mind. But he is not. It works beautifully. According to John:

Artificial intelligence is just counting stuff…. Excel can do this.

And thus, after 45 minutes of Excel operations I had a naïve bays model that classified 19 out of 20 tweets correctly. It was a lot of fun, and surprisingly enough, John was not the only one talking about Excel as a tool for data science. Felienne Hermans (@felienne) from the Delft University of Technology introduced several plug-ins for Excel (see her blog) to make it a better tool for the data world. This also shows how much the data world has matured: we have started to offer tools that every business consultant knows, so that they can think with us about the right application of data.

The Future: Data Demystified

What is next? It will be easier to get data, and it will be easier to clean, and easier to chart, and by using this data, we can more easily predict…. predict… predict. Yes, what is it that we actually wanted to predict?

Data demystified does not mean that we have solved our problems in this world. It just means we have better technology that enables us to focus on what is important. We work with data because we want to change a behavior or for it to result in an action. No one said this better than British science historian James Burke during the main Strata plenary session:

Information is causing change… If it is not causing change, it is not information.

He then looked in the audience and said,

No information: you are sitting in a seat.

Information: the person next to you has a miasmal disease.”

Yes… We tend to forget this. We are here in the data world for a reason. We want to change the world with data. Technology is making this job easier and the tools became better, but what counts are the results. And those results can also be found at Strata.

For example, Chris Harland from Microsoft explained how he uses data to improve business at bars. He measures the behavior of guests at bars, and one of his stunning facts was that Corona beer is a good predictor for more spending. But dear bar owners, please do not force your customers to drink Corona… as that would be mixing cause and correlation.

Corona is a good predictor for spending behavior. Do not mix up cause and correlation.

Another fascinating (meaning action-oriented) talk was given by Drew Sullivan, on the Organized Crime and Corruption Reporting Project. He used data on money movement to show how to detect fraudulent activities in Montenegro.

Now since data is demystified, let’s apply it: turn our businesses around and become data-driven. This means that data scientists should learn more about business, and businesses should become more like data scientists. Perhaps a new role might be that of a business scientist?

17ff056

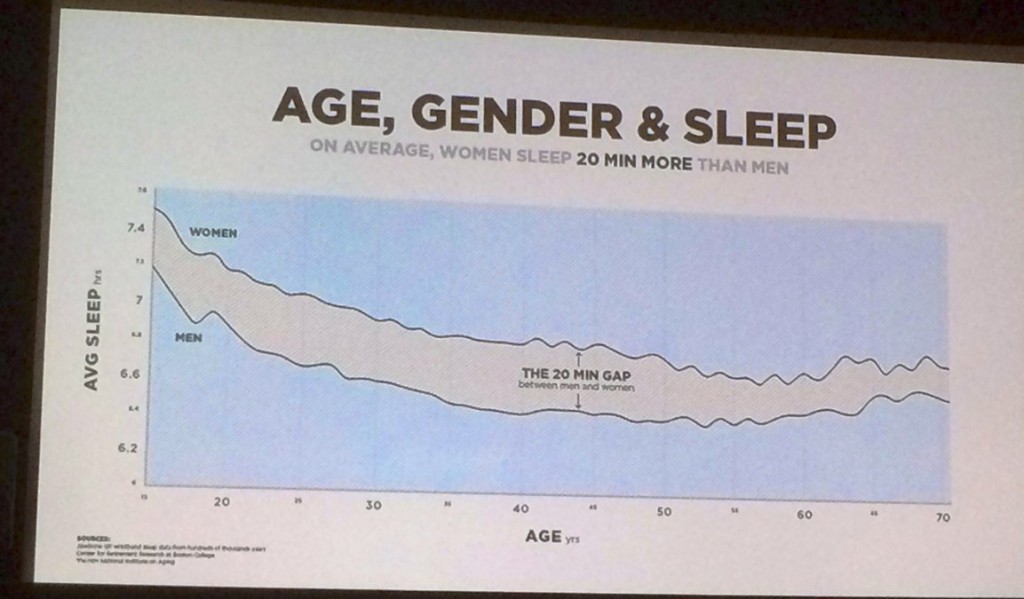
But do not be fooled. Getting the question right is the hardest part. I describe this issue in depth in my book Ask-Measure-Learn (O’Reilly). Take Monica Rogati‘s (@mrogati) presentation as an example. She is the famous data scientist who demonstrated in a well-received talk that woman sleep 20 minutes longer than men, on average. Ok, but how does that help me? This insight is amusing at best. The real question is what to do with this kind of information. Knowing Monica, she has already a new product based on data in mind. Let’s see what she will have to say about it at the next Strata. I know I will be there.[/vc_column_text][/vc_column][/vc_row]

Data Products

3 Data Products You Need To Know

[vc_row][vc_column width=”1/1″][vc_column_text]Today, we see discussions on big data everywhere. Big data – which we were promised in 2011, when this hype started – surrounds all of us and will lead to new products – DATA PRODUCTS. Those who are able to spot and build new data products will become the leaders in the industry, in the same way that Google became the leader of all search engines, Amazon became the leader of online retail, and so on. But as it turns out, life is never as simple as one would hope. What is a data product, actually?

What Is A Data Product?

I have been analyzing many startup companies and data-driven products, and have found that data is used in three essential ways (Tweet this).

  • Data used for benchmarking
  • Data used for recommendation systems
  • Data used for predictions

Benchmarking

Benchmarking is the most common way we use data today. It is also the easiest way. We have all known how to benchmark since the first grade. What does an A-grade or a D-grade mean? Nothing – at least, it means nothing as long as you do not view those grades in relation to others. Benchmarking is an old concept; what is new is that we can measure almost every process within a modern company. Call centers measure who picks up the phone faster, online retailers measure everything via A/B tests, and recruiting departments monitor the close rate for applicants over time. Take LinkedIn – at their core, a data-driven company. They have several hundred different dashboards, all benchmarking numbers in time series, across businesses, countries, and so on.

04d4231

As the benchmark industry matures, we see two major developments. On one hand, the actual platform retrieving and displaying data becomes easier to be used (here, you can read about how data is demystified). LinkedIn, for example, built its own platform to display data (See Jonathan Wu’s presentation at the Strata in NY). But there are other commercial ones out there,  such as DOMOTableau and LOOKER. The basic idea is: “Data for the people.” Why? In order to benchmark.

The second development we see is data marts. Not every company has compiled a vast amount of data – particularly, young startups. Surely there are many data providers that would allow you to enrich your own data. Take Acxiom or Alliant – they supply behavioral, demographic, and financial data. But, the ability to benchmark your own data is limited because the data is bought. To benchmark data, a new approach is needed. A good example of a good approach is compass.co, a service that compares your very own data with similar in the same market (Disclaimer: I am an advisor to Compass.co).

Benchmarking data is the simplest solution of the three if you are looking to create value, and insights generated from benchmarks can be impressive. Mark Duggan et al. benchmarked, for example, the theoretical expected distribution of losing and winning Sumo matches with the actual reality. Through this kind of research, corruption in wrestling became apparent. During the world championship in soccer, the Economist used benchmarking to show all goals ever scored in a benchmark (see the full picture here). This benchmark is not as nice and actionable as Duggan’s, but at least it tells you that the 18th and the 75th minute are the most ball-rich ones. Thus, these are not the best times to step out of the room.

Read more about this in my next post: I will talk more about recommendation systems and why they have contributed the most to the current hype of big data.[/vc_column_text][/vc_column][/vc_row]
Small Data

Rule The World With Small Data

[vc_row][vc_column width=”1/1″][vc_column_text]I was recently asked to “outline a vision of what big data may do in the future” for a book published by Dave Coplin, Microsoft’s Chief Envisioning Officer. Yes, I agree that it is time for a new vision – but not on big data, on small data.

Data is nothing new, despite the hype we have seen recently. We have been creating data for centuries. For example, the Incas measured time using two pillars of stone in the 15th century to know when to plant their crops. (Read more about this in “The Archaeology of Measurement” by Iain Morley and Colin Renfrew)

28a25c9

(photo by marcel )

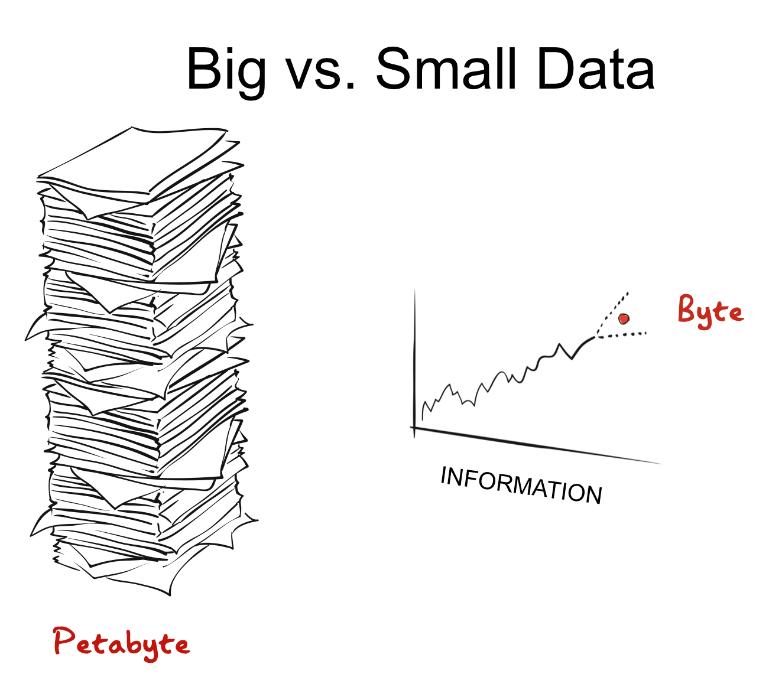
What has changed since the times of the Incas? The amount of data we produce! Everything from a simple e-mail to the onboard computers in our cars leave a broad trail of data nowadays. We are living in a mind blowing world of big data: exabytes of daily information created, trending ever upwards.

DATA CHANGES OUR WORLD

We hear lots of inspiring stories about the value of this data. The police will soon be able to predict crime before it happens (read more here about Georg Mohler’s work). Health checks will predict illnesses before they reach us and US army could have known the position of Osama Bin Laden just through text-mining traditional news media (read more about Kalev Leetaru’s work)

The data evolution is indeed creating new opportunities that are changing ecosystems as a whole. Take the media industry as an example. The demand for media has not changed. I have been arguing for a while that the media industry is doing better than ever, only that the traditional players are losing their revenue stakes (see this talk). However, new business models are appearing that have not existed before and are only made possible through data.

WE WANT SMALL DATA

More data alone does not mean more business models or more insights. We all know this from personal experience – ever since we began digitalizing our personal photos, we have seen 10x to 100x more of them. These photos need to be stored, tagged, and sorted… Which is actually more work than was when we had only a few real prints to sort.

Your personal issues with too many photos to sort through translate into business as well. More data means more of a pain. It means more issues in handling the data and finding what you really want to look at. Let’s look back at the Incas. They wanted to know only one thing: when to plant the crops. This is not big data. This is a binary decision: yes or no. This has not changed. You as a leader need to make binary decisions as well. Should I buy this company or not? Should we run this marketing campaign or not? Should we hire someone or not? What you want is small data, not big data. We want information!

3b3b0f2

Thus should we then dismiss all of those big data discussions? No, not at all. Some things only work because we have big data. LinkedIn can only recommend a company with certain values or certain types of jobs to a person because we have big data. Many of the services we offer today to 300 million members would not have been possible with just 10 million. This long tail of data is important.

However, the important part is being able to reduce big data so you are looking at the right metric. I have seen many companies mistake data-driven decisions with an obsession with numbers. (tweet now: “#DataDriven is not being Number Obsessed.”) Those companies take all the possible metrics they can measure, cram it into a dashboard, and ask their management to review it daily. Bigger is not better here: most businesses have only a few focus points, and keeping it simple is a good rule for dealing with data.

ASK – MEASURE – LEARN

What is a simple way of steering your business through massive amounts of data? It is this three step approach:

  • Ask the right question.
  • Use the right data and measures, and
  • Learn in order to take action upon them.

Sounds simple, right? It isn’t. Do you remember AltaVista – the search engine? They measured URLs in many ways. They were proud that they could classify different parts of the internet, but it was Google’s Page Rank’s simple metric that halved their business in just 12 months. AltaVista had failed to both ASK the right question and to MEASURE the right metrics.

Thus, as simple as this framework sounds, it is not easy to do. Read more examples on how to use this framework across different industries in the book Ask-Measure-Learn, or get a free chapter here.

If you follow these rules, the future of data is promising. You will be able to create data-driven products. Here are some examples:

  • Benchmarking performance – For example, which marketing campaign performed better?
  • Recommendations – Such as, who you might know at LinkedIn?
  • Predictions –Target, for example, uses their loyalty card data to predict whether or not someone is pregnant and markets directly to them.

If you use data effectively in any of these three areas, you might change or discover entirely new business models. If you can do this, your future will be bright. Because one thing has not changed since the time of the Incas: the one who knows how to create value – whether it is when to plant maize or how to target customers – becomes the ruler.

Go out and rule the world made out of data – small data.

This is a slightly adapted version of a chapter of the book: “The Rise of the Humans: How to outsmart the digital deluge” by Dave Coplin.[/vc_column_text][vc_column_text]I was recently asked to “outline a vision of what big data may do in the future” for a book published by Dave Coplin, Microsoft’s Chief Envisioning Officer. Yes, I agree that it’s time for a vision – but not on big data, on Small Data.

Data is nothing new, despite the hype we have seen recently. We have been creating data for centuries. For example, the Incas measured time using two pillars of stone in the 15th century to know when to plant their crops. (Read more about this in “The Archaeology of Measurement” by Iain Morley and Colin Renfrew)

28a25c9

(photo by marcel )

What has changed since the times of the Incas? The amount of data we produce! Everything from a simple e-mail to the onboard computers in our cars leave a broad trail of data nowadays. We are living in a mind blowing world of big data: exabytes of daily information created, trending ever upwards.

DATA CHANGES OUR WORLD

We hear lots of inspiring stories about the value of this data. The police will soon be able to predict crime before it happens (read more here about Georg Mohler’s work). Health checks will predict illnesses before they reach us and US army could have known the position of Osama Bin Laden just through text-mining traditional news media (read more about Kalev Leetaru’s work)

The data evolution is indeed creating new opportunities that are changing ecosystems as a whole. Take the media industry as an example. The demand for media has not changed. I have been arguing for a while that the media industry is doing better than ever, only that the traditional players are losing their revenue stakes (see this talk). However, new business models are appearing that have not existed before and are only made possible through data.

WE WANT SMALL DATA

More data alone does not mean more business models or more insights. We all know this from personal experience – ever since we began digitalizing our personal photos, we have seen 10x to 100x more of them. These photos need to be stored, tagged, and sorted… Which is actually more work than was when we had only a few real prints to sort.

Your personal issues with too many photos to sort through translate into business as well. More data means more of a pain. It means more issues in handling the data and finding what you really want to look at. Let’s look back at the Incas. They wanted to know only one thing: when to plant the crops. This is not big data. This is a binary decision: yes or no. This has not changed. You as a leader need to make binary decisions as well. Should I buy this company or not? Should we run this marketing campaign or not? Should we hire someone or not? What you want is small data, not big data. We want information!

3b3b0f2

Thus should we then dismiss all of those big data discussions? No, not at all. Some things only work because we have big data. LinkedIn can only recommend a company with certain values or certain types of jobs to a person because we have big data. Many of the services we offer today to 300 million members would not have been possible with just 10 million. This long tail of data is important.

However, the important part is being able to reduce big data so you are looking at the right metric. I have seen many companies mistake data-driven decisions with an obsession with numbers. (tweet now: “#DataDriven is not being Number Obsessed.”) Those companies take all the possible metrics they can measure, cram it into a dashboard, and ask their management to review it daily. Bigger is not better here: most businesses have only a few focus points, and keeping it simple is a good rule for dealing with data.

ASK – MEASURE – LEARN

What is a simple way of steering your business through massive amounts of data? It is this three step approach:

  • Ask the right question.
  • Use the right data and measures, and
  • Learn in order to take action upon them.

Sounds simple, right? It isn’t. Do you remember AltaVista – the search engine? They measured URLs in many ways. They were proud that they could classify different parts of the internet, but it was Google’s Page Rank’s simple metric that halved their business in just 12 months. AltaVista had failed to both ASK the right question and to MEASURE the right metrics.

Thus, as simple as this framework sounds, it is not easy to do. Read more examples on how to use this framework across different industries in the book Ask-Measure-Learn, or get a free chapter here.

If you follow these rules, the future of data is promising. You will be able to create data-driven products. Here are some examples:

  • Benchmarking performance – For example, which marketing campaign performed better?
  • Recommendations – Such as, who you might know at LinkedIn?
  • Predictions –Target, for example, uses their loyalty card data to predict whether or not someone is pregnant and markets directly to them.

If you use data effectively in any of these three areas, you might change or discover entirely new business models. If you can do this, your future will be bright. Because one thing has not changed since the time of the Incas: the one who knows how to create value – whether it is when to plant maize or how to target customers – becomes the ruler.

Go out and rule the world made out of data – small data.

This is a slightly adapted version of a chapter of the book: “The Rise of the Humans: How to outsmart the digital deluge” by Dave Coplin.[/vc_column_text][vc_column_text]I was recently asked to “outline a vision of what Big Data may do in the future” for a book published by Dave Coplin – Microsoft’s Chief Envisioning Officer. Yes, it’s time for a vision but not on Big but on Small Data.

Data is nothing new, despite the hype we recently see. We have been creating data for centuries. For example, the Incas measured time using two pillars of stone in the 15th century, to know when to plant their crops. (Read more in “The Archaeology of Measurement” by Iain Morley and Colin Renfrew)

28a25c9

(photo by marcel )

What has changed since the times of the Inkas? The amount of data we produce! Everything from a simple e-mail to the onboard computers in our cars leaves a broad trail of data nowadays. We are living in a mind blowing world of big data: exabytes of daily information trending ever upwards.

DATA CHANGES OUR WORLD

We hear lots of inspiring stories about the value in this data. The police will be able to predict crime before it happens (read more here about Georg Mohler’s work). Health checks will predict illnesses before they reach us and US army could have known the position of Osama Bin Laden just through text-mining traditional news media (read more about Kalev Leetaru’s work)

The data evolution is indeed creating new opportunities that are changing whole ecosystems. Take the media industry as an example. The demand for media has not changed. I have argued for a while that the media industry is doing better than ever, only the traditional players are losing their revenue stake (see this talk). But new business models are appearing that did not exist before and are only made possible through data.

WE WANT SMALL DATA

But more data alone does not mean more business models or more insights. We all know this from personal experience. Since we digitalized our personal photos we now have 10x or 100x more of them. However these photos need to be stored, tagged, and sorted… which is actually more work than the old times where we had only a few real prints.

Your personal issues with too many photos are true for business as well. More data means more pain. It means more issues in handling the data and finding what you really want. Let’s look back at the Incas. They wanted to know only one thing: when to plant the crops. This is not big data. This is a binary decision. Yes or no. This has not changed. You as a leader need to make binary decisions as well. Should I buy this company or not? Should we run this marketing campaign or not? Should we hire someone or not? What you want is small data, not big data. We want information!

3b3b0f2

Thus should we then dismiss all of those big data discussions? No, not at all. Some things only work because we have big data. LinkedIn can only recommend a company with certain values or certain types of jobs to a person because we have big data. Many of the services we offer today with 300 million members would not have been possible with just 10 million. This long tail of data is important.

However, the important part is to reduce this data so you are looking at the right metric. I have seen many companies mistake data-driven decisions for an obsession with numbers. (tweet now: “#DataDriven is not being Number Obsessed.”) Those companies take all the possible metrics they can measure, cram it into a dashboard, and ask their management to review it daily. More is not better here: most businesses have only a few focus points, and keeping it simple is a good rule for dealing with data.

ASK – MEASURE – LEARN

How do we get to a simple way of steering your business through massive amounts of data? It is a three step approach:

  • Ask the right question.
  • Use the right data & measures and
  • Learn and take actions upon them.

Sounds simple? Right? But it is not. Do you remember AltaVista – the search engine? They measured many things about URLs. They were proud to classify much of the online web. But it was the simple metric of Google’s Page Rank that halved their business in just 12 months. AltaVista had failed to either ASK the right question or to MEASURE the right metrics.

Thus as simple as this framework sounds, it is not easy to do. Read more examples on how to use this framework across different industries in the book Ask-Measure-Learn or get a free chapter here.

If you follow these rules, the future of data is promising. You will be able to create data driven products. Here are some examples:

  • Benchmarking performance – For example, which marketing campaign performed better?
  • Recommendations – such as who you might know at LinkedIn?
  • Prediction –Target, for example, uses their loyalty card data to predict whether someone is pregnant and market directly to them.

If you use data effectively for any of these three areas you might find new or change existing business models. And if you do so your future will be bright. Because one thing has not changed since the time of the Incas: the one who knows how to create value – whether it is when to plant maize or how to target customers – becomes the ruler.

Go and rule the world made out of data – small data.

This is a slightly adapted version of a chapter in the book: “The Rise of the Humans: How to outsmart the digital deluge” by Dave Coplin.[/vc_column_text][/vc_column][/vc_row][vc_row][vc_column width=”1/1″][vc_column_text]I was recently asked to “outline a vision of what big data may do in the future” for a book published by Dave Coplin, Microsoft’s Chief Envisioning Officer. Yes, I agree that it’s time for a vision – but not on big data, on Small Data.

Data is nothing new, despite the hype we have seen recently. We have been creating data for centuries. For example, the Incas measured time using two pillars of stone in the 15th century to know when to plant their crops. (Read more about this in “The Archaeology of Measurement” by Iain Morley and Colin Renfrew)

28a25c9

(photo by marcel )

What has changed since the times of the Incas? The amount of data we produce! Everything from a simple e-mail to the onboard computers in our cars leave a broad trail of data nowadays. We are living in a mind blowing world of big data: exabytes of daily information created, trending ever upwards.

DATA CHANGES OUR WORLD

We hear lots of inspiring stories about the value of this data. The police will soon be able to predict crime before it happens (read more here about Georg Mohler’s work). Health checks will predict illnesses before they reach us and US army could have known the position of Osama Bin Laden just through text-mining traditional news media (read more about Kalev Leetaru’s work)

The data evolution is indeed creating new opportunities that are changing ecosystems as a whole. Take the media industry as an example. The demand for media has not changed. I have been arguing for a while that the media industry is doing better than ever, only that the traditional players are losing their revenue stakes (see this talk). However, new business models are appearing that have not existed before and are only made possible through data.

WE WANT SMALL DATA

More data alone does not mean more business models or more insights. We all know this from personal experience – ever since we began digitalizing our personal photos, we have seen 10x to 100x more of them. These photos need to be stored, tagged, and sorted… Which is actually more work than was when we had only a few real prints to sort.

Your personal issues with too many photos to sort through translate into business as well. More data means more of a pain. It means more issues in handling the data and finding what you really want to look at. Let’s look back at the Incas. They wanted to know only one thing: when to plant the crops. This is not big data. This is a binary decision: yes or no. This has not changed. You as a leader need to make binary decisions as well. Should I buy this company or not? Should we run this marketing campaign or not? Should we hire someone or not? What you want is small data, not big data. We want information!

3b3b0f2

Thus should we then dismiss all of those big data discussions? No, not at all. Some things only work because we have big data. LinkedIn can only recommend a company with certain values or certain types of jobs to a person because we have big data. Many of the services we offer today to 300 million members would not have been possible with just 10 million. This long tail of data is important.

However, the important part is being able to reduce big data so you are looking at the right metric. I have seen many companies mistake data-driven decisions with an obsession with numbers. (tweet now: “#DataDriven is not being Number Obsessed.”) Those companies take all the possible metrics they can measure, cram it into a dashboard, and ask their management to review it daily. Bigger is not better here: most businesses have only a few focus points, and keeping it simple is a good rule for dealing with data.

ASK – MEASURE – LEARN

What is a simple way of steering your business through massive amounts of data? It is this three step approach:

  • Ask the right question.
  • Use the right data and measures, and
  • Learn in order to take action upon them.

Sounds simple, right? It isn’t. Do you remember AltaVista – the search engine? They measured URLs in many ways. They were proud that they could classify different parts of the internet, but it was Google’s Page Rank’s simple metric that halved their business in just 12 months. AltaVista had failed to both ASK the right question and to MEASURE the right metrics.

Thus, as simple as this framework sounds, it is not easy to do. Read more examples on how to use this framework across different industries in the book Ask-Measure-Learn, or get a free chapter here.

If you follow these rules, the future of data is promising. You will be able to create data-driven products. Here are some examples:

  • Benchmarking performance – For example, which marketing campaign performed better?
  • Recommendations – Such as, who you might know at LinkedIn?
  • Predictions –Target, for example, uses their loyalty card data to predict whether or not someone is pregnant and markets directly to them.

If you use data effectively in any of these three areas, you might change or discover entirely new business models. If you can do this, your future will be bright. Because one thing has not changed since the time of the Incas: the one who knows how to create value – whether it is when to plant maize or how to target customers – becomes the ruler.

Go out and rule the world made out of data – small data.

This is a slightly adapted version of a chapter of the book: “The Rise of the Humans: How to outsmart the digital deluge” by Dave Coplin.[/vc_column_text][vc_column_text]I was recently asked to “outline a vision of what Big Data may do in the future” for a book published by Dave Coplin – Microsoft’s Chief Envisioning Officer. Yes, it’s time for a vision but not on Big but on Small Data.

Data is nothing new, despite the hype we recently see. We have been creating data for centuries. For example, the Incas measured time using two pillars of stone in the 15th century, to know when to plant their crops. (Read more in “The Archaeology of Measurement” by Iain Morley and Colin Renfrew)

28a25c9

(photo by marcel )

What has changed since the times of the Inkas? The amount of data we produce! Everything from a simple e-mail to the onboard computers in our cars leaves a broad trail of data nowadays. We are living in a mind blowing world of big data: exabytes of daily information trending ever upwards.

DATA CHANGES OUR WORLD

We hear lots of inspiring stories about the value in this data. The police will be able to predict crime before it happens (read more here about Georg Mohler’s work). Health checks will predict illnesses before they reach us and US army could have known the position of Osama Bin Laden just through text-mining traditional news media (read more about Kalev Leetaru’s work)

The data evolution is indeed creating new opportunities that are changing whole ecosystems. Take the media industry as an example. The demand for media has not changed. I have argued for a while that the media industry is doing better than ever, only the traditional players are losing their revenue stake (see this talk). But new business models are appearing that did not exist before and are only made possible through data.

WE WANT SMALL DATA

But more data alone does not mean more business models or more insights. We all know this from personal experience. Since we digitalized our personal photos we now have 10x or 100x more of them. However these photos need to be stored, tagged, and sorted… which is actually more work than the old times where we had only a few real prints.

Your personal issues with too many photos are true for business as well. More data means more pain. It means more issues in handling the data and finding what you really want. Let’s look back at the Incas. They wanted to know only one thing: when to plant the crops. This is not big data. This is a binary decision. Yes or no. This has not changed. You as a leader need to make binary decisions as well. Should I buy this company or not? Should we run this marketing campaign or not? Should we hire someone or not? What you want is small data, not big data. We want information!

3b3b0f2

Thus should we then dismiss all of those big data discussions? No, not at all. Some things only work because we have big data. LinkedIn can only recommend a company with certain values or certain types of jobs to a person because we have big data. Many of the services we offer today with 300 million members would not have been possible with just 10 million. This long tail of data is important.

However, the important part is to reduce this data so you are looking at the right metric. I have seen many companies mistake data-driven decisions for an obsession with numbers. (tweet now: “#DataDriven is not being Number Obsessed.”) Those companies take all the possible metrics they can measure, cram it into a dashboard, and ask their management to review it daily. More is not better here: most businesses have only a few focus points, and keeping it simple is a good rule for dealing with data.

ASK – MEASURE – LEARN

How do we get to a simple way of steering your business through massive amounts of data? It is a three step approach:

  • Ask the right question.
  • Use the right data & measures and
  • Learn and take actions upon them.

Sounds simple? Right? But it is not. Do you remember AltaVista – the search engine? They measured many things about URLs. They were proud to classify much of the online web. But it was the simple metric of Google’s Page Rank that halved their business in just 12 months. AltaVista had failed to either ASK the right question or to MEASURE the right metrics.

Thus as simple as this framework sounds, it is not easy to do. Read more examples on how to use this framework across different industries in the book Ask-Measure-Learn or get a free chapter here.

If you follow these rules, the future of data is promising. You will be able to create data driven products. Here are some examples:

  • Benchmarking performance – For example, which marketing campaign performed better?
  • Recommendations – such as who you might know at LinkedIn?
  • Prediction –Target, for example, uses their loyalty card data to predict whether someone is pregnant and market directly to them.

If you use data effectively for any of these three areas you might find new or change existing business models. And if you do so your future will be bright. Because one thing has not changed since the time of the Incas: the one who knows how to create value – whether it is when to plant maize or how to target customers – becomes the ruler.

Go and rule the world made out of data – small data.

This is a slightly adapted version of a chapter in the book: “The Rise of the Humans: How to outsmart the digital deluge” by Dave Coplin.[/vc_column_text][/vc_column][/vc_row]