Every morning, New York City police officers receive insights from computers, directing them to areas where crime is likely to occur. If that sounds similar to the 2002 sci-fi movie Minority Report, it’s because it is quite similar. While the NYPD may not use futuristic “precogs” to target specific individuals before they commit a crime, the department does use a computer program to identify “hotspots” where crime is likely to occur. But in both the movie and in New York, the prediction is just that — a prediction. The actions taken by the police are the reality, and unfortunately, sometimes a racially unjust reality.
We analyzed the NYPD’s stop-and-frisk program and found that while the overall number of incidents has declined significantly since a redesign of the policy, there is an unsettling increase in racial imbalance in at least eight NYC precincts.![]()
The “stop-and-frisk” program
From its inception, the stop-and-frisk program sought to reduce crime by giving policing officers the authority to identify and search suspicious individuals for weapons and contraband. The stop-and-frisk tactics gained greater traction with the implementation of CompStat in the 1990s. This process employed Geographic Information Systems in order to map crime and identify problems, taking into account past criminal trends in neighborhoods and allowing officers to quickly address crime spikes. Over the past two decades, the practice evolved into the “stop-and-frisk” program we know today – where at one point stops exceeded over fifty thousand a month, largely targeting minorities. In 2012, racial minorities accounted for 92% of all stop-and-frisk incidents. The disparate impact of the stops on minorities led to public outcry and received extensive coverage from The New York Times, Slate, The Atlantic, eventually resulting in a legal case against the city.
Today, the NYPD is hoping to improve its’ policing tactics and is conducting a two-year trial run with predictive policing software, Hunchlab. While the Hunchlab algorithm does not take into account individual characteristics, such as race, ethnicity, or gender, it does incorporate factors such as “socioeconomic indicators; historic crime levels; and near-repeat patterns to help police departments understand and respond more effectively to crime.” Certainly, this brings doubt as to whether or not the software will reduce the disproportionate burden of current policing tactics on minority communities. In the meantime, we should be questioning what individual precincts can learn from others and what they can do to improve their policing practices for all.
Breaking it down by precinct
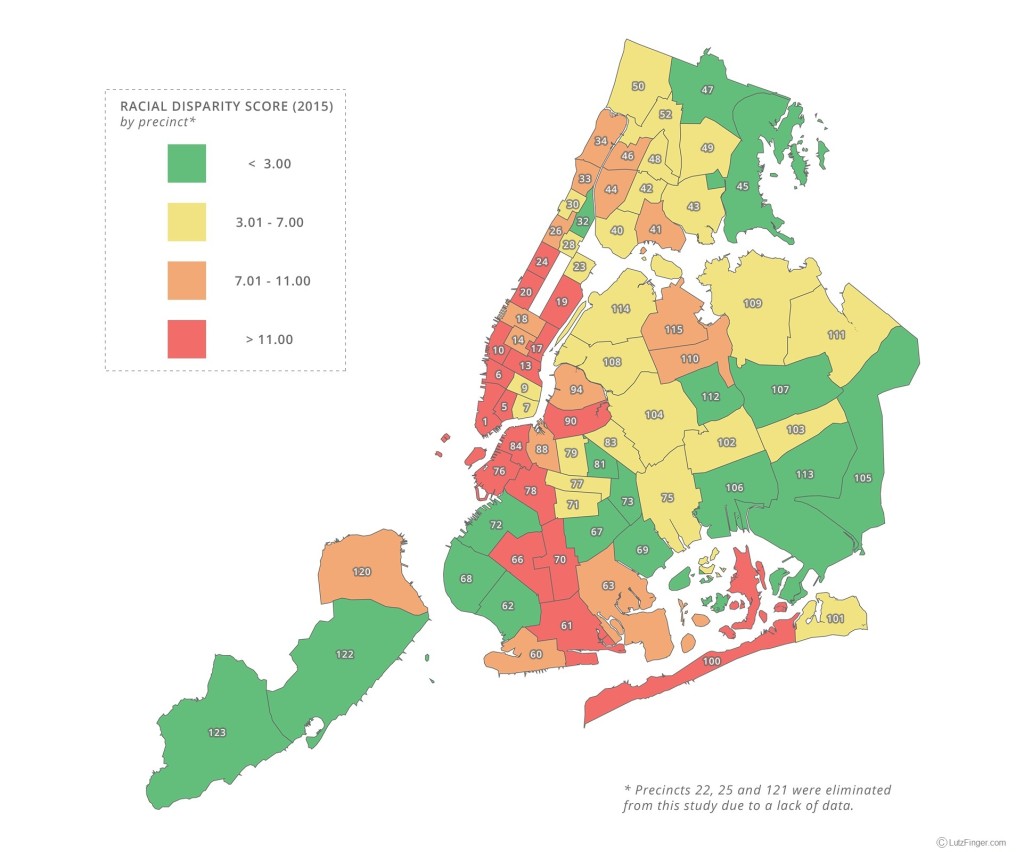
While prior analyses of the stop-and-frisk program mainly focused on the overall discriminatory practices of the policy, we looked at precinct level data to identify areas with the largest disparities between the racial makeup of the community and the racial makeup of the stop-and-frisk incidents within that community. In other words, holding all else equal, in a precinct where 10% of the community is black, black residents should represent only 10% of the total number of stop-and-frisk incidents occurring in that community. If that number is substantially higher than 10%, then racial profiling may be contributor to this disparity. To compare precincts we created an index called the Racial Disparity Index (RDI) to compare across precincts.
Our study showed that neighborhoods with the greatest racial disparity between the race of people stopped and the racial makeup of the residents are predominantly white neighborhoods, with the exception of Chinatown. These neighborhoods include the Upper East Side, Greenwich Village, Upper West Side, Park Slope, Tribeca, Soho, Brooklyn Heights, Midtown East, and Chinatown. For example, Precinct 19, part of the Upper East Side, recorded the highest level of racial disparity in 2015, reaching a score of 31.41 on our index. Out of the 278 stops conducted there, nearly half were against black residents, even though they make up a mere 2.3% of the population.
Many precincts showed an increase in Racial Disparity Index (RDI) scores over the past five years ![]() , even after the NYPD enacted reforms in attempt to reduce racial profiling within the program. While in 2012 the Racial Disparity Index (RDI) was at 7.6 (average over all precincts) it went up after the program changed to a 8.9 in 2015 conveying that the stop-and-frisk program has become more imbalanced. Or said differently, if you are not part of the racial majority of a specific community, you still have a higher likelihood of being stopped. In 2015, out of the 270 stops that occurred in Precinct 84, Brooklyn Heights, three-fourths of them were carried out against black residents, a minority group in the community.
, even after the NYPD enacted reforms in attempt to reduce racial profiling within the program. While in 2012 the Racial Disparity Index (RDI) was at 7.6 (average over all precincts) it went up after the program changed to a 8.9 in 2015 conveying that the stop-and-frisk program has become more imbalanced. Or said differently, if you are not part of the racial majority of a specific community, you still have a higher likelihood of being stopped. In 2015, out of the 270 stops that occurred in Precinct 84, Brooklyn Heights, three-fourths of them were carried out against black residents, a minority group in the community.
It is unclear what leads to this increased disparity over time, but we see several plausible reasons. For one it could be the way crime is conducted has changed between 2012 and today. Criminals are mobile and might move into other precincts changing the RDI. In this case we are seeing a reflection of this occurrence. On the other hand it could be that the system as such is skewed. Here are two possible elements: the human and the machine.
- The human element: It is ultimately an officer’s decision to stop an individual in a given area. If the officers were to hold a racial prejudice, then this will be reflected on aggregate in the overall data.
- The machine: We often think about computer programs as unbiased, but unfortunately that might not always be the case
 . While the Hunchlab algorithm does not include race in its model, the historical data used to train this model could have a hidden component of racial prejudice. As we know, any algorithm is only as good as the data we feed it.
Something is working
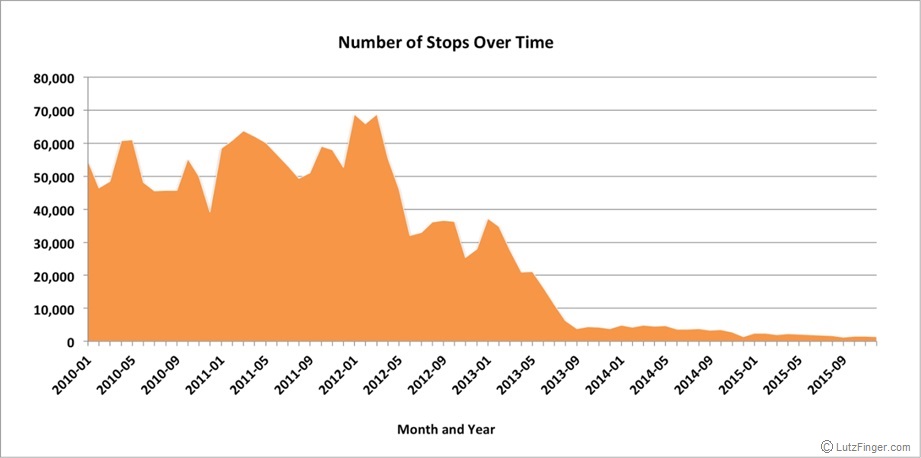
Undoubtedly, racial discrimination has plagued the stop-and-frisk program from the beginning. As one can see in the image below, public outcry and the resulting policy reform led to a dramatic decrease in the number of stops conducted.
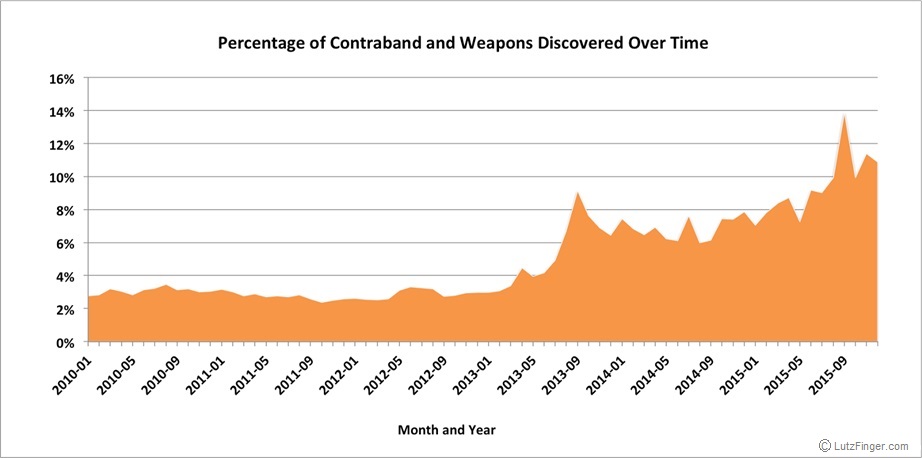
At the same time, the overall effectiveness of the policy, as measured by the percentage of stops in which contraband is recovered, has increased. From this, we can infer that the stops have become more effective.
Our analysis breaks down the success of the program by precinct. For example, Precinct 72, which includes Greenwood and Sunset Park, has managed to lower the racial disparity of stop-and-frisk occurrences while simultaneously increasing the effectiveness of its’ tactics from 3.69% to 7.38% over the past five years. The racial makeup of the precinct is well mixed between Asian, Hispanic, and White. Meanwhile, Precinct 78 (Park Slope), which is adjacent to 72, has seen the greatest increase in disparity, from an RDI score of 18.17 in 2010 to 25.13 in 2015, while only marginally improving its’ contraband discovery. This suggests that the increased policing against racial minorities has not proven to be effective in recovering contraband in the precinct.
Other Possibilities
Racial disparity is not the only issue that predictive policing algorithms are facing. It is important to keep in mind we use the metric “percent of contraband found” as a key performance indicator for the program, as the city uses this criteria. This might be a misleading metric. For example, let’s assume the amount of contraband in the city is increasing as the city becomes less safe. The likelihood of finding contraband during a stop-and-frisk incident would then increase as well. In this scenario, that doesn’t translate to a successful program, but rather displays an indication of the opposite. Moreover, these algorithms only spot correlation based on past data. Sending police to a hotspot does not expose the underlying cause of why the crime actually occurred.
While predictive policing is a booming sector with software coming from companies such as Azavea, PredPol, and Hitachi, an analysis of the data from the NYPD’s stop-and-frisk program reveals legitimate concerns to the data-driven approach. How city tactics change over time will need to be closely monitored to ensure a fair and non-discriminatory approach, while also taking a look at the root cause of criminal activity.
Who we are
The analysis of the NYPD’s stop-and-frisk program was performed by Maciej Szelazek, Maggie Barnes and Derek Cutting together with Lutz Finger as part of his course on Data Products at Cornell Tech. Further insights into data can be seen here.
This article was first published at Forbes.